Smartcharts chart anatomy: every control explained
Smartcharts puts market identity, price history, indicators, drawings, and alerts in one workspace. This guide names each area so you can tell what the chart is showing before you make a note or compare a company.
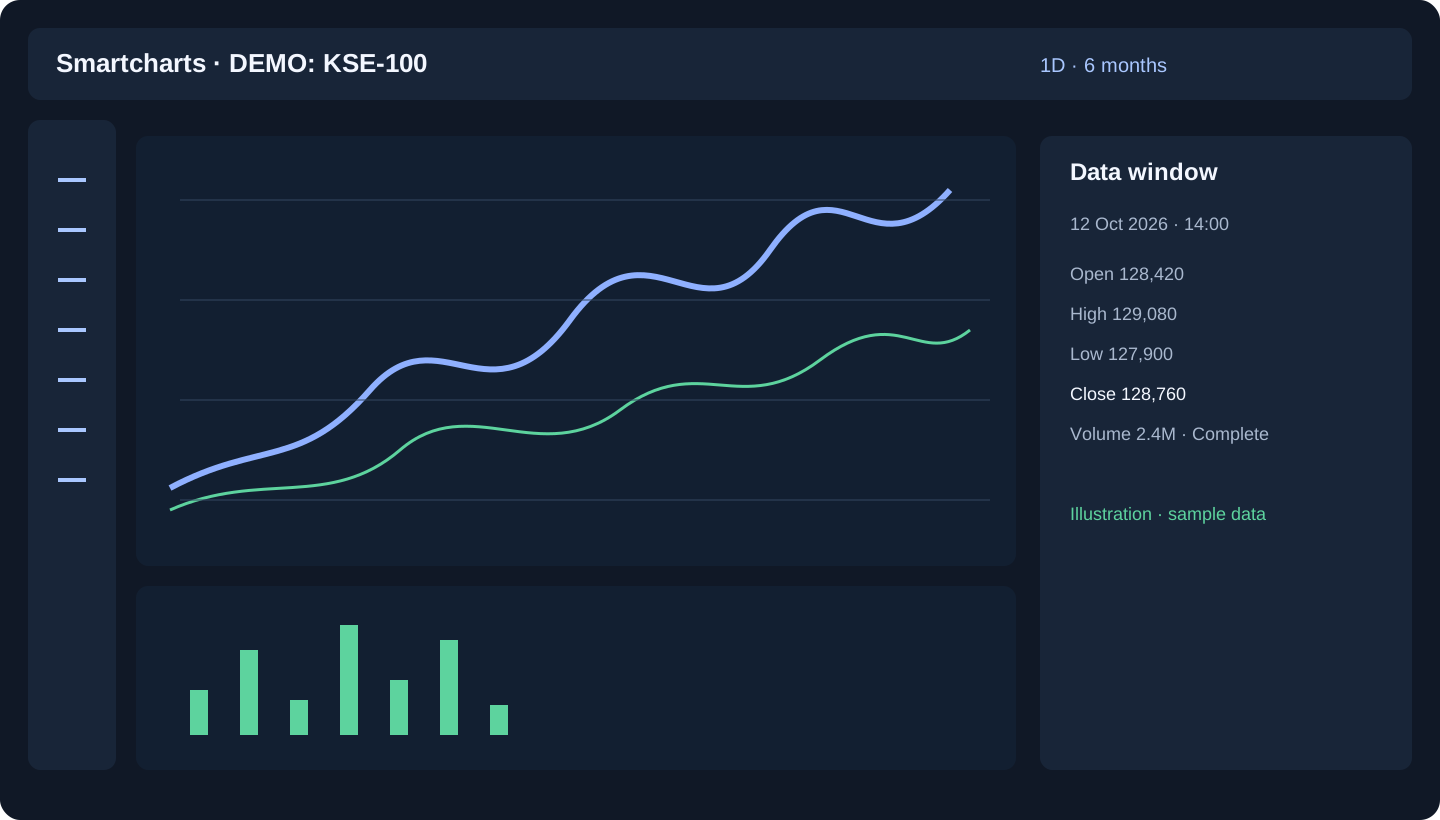
Symbol and market identity
The symbol header identifies the selected security and market. Confirm the company, exchange, and currency before reading a value. A chart is only useful when its identity matches the question you are asking.
Resolution and time range
Resolution controls the width of each bar, such as one day or one hour. The time range controls how many bars are loaded. A short range can make a move look larger; a long range adds context.
Price, indicator, and volume panes
The price pane shows OHLC or close-only data. Indicator panes render calculated series below it. Volume is a separate scale because traded units do not share the price axis.
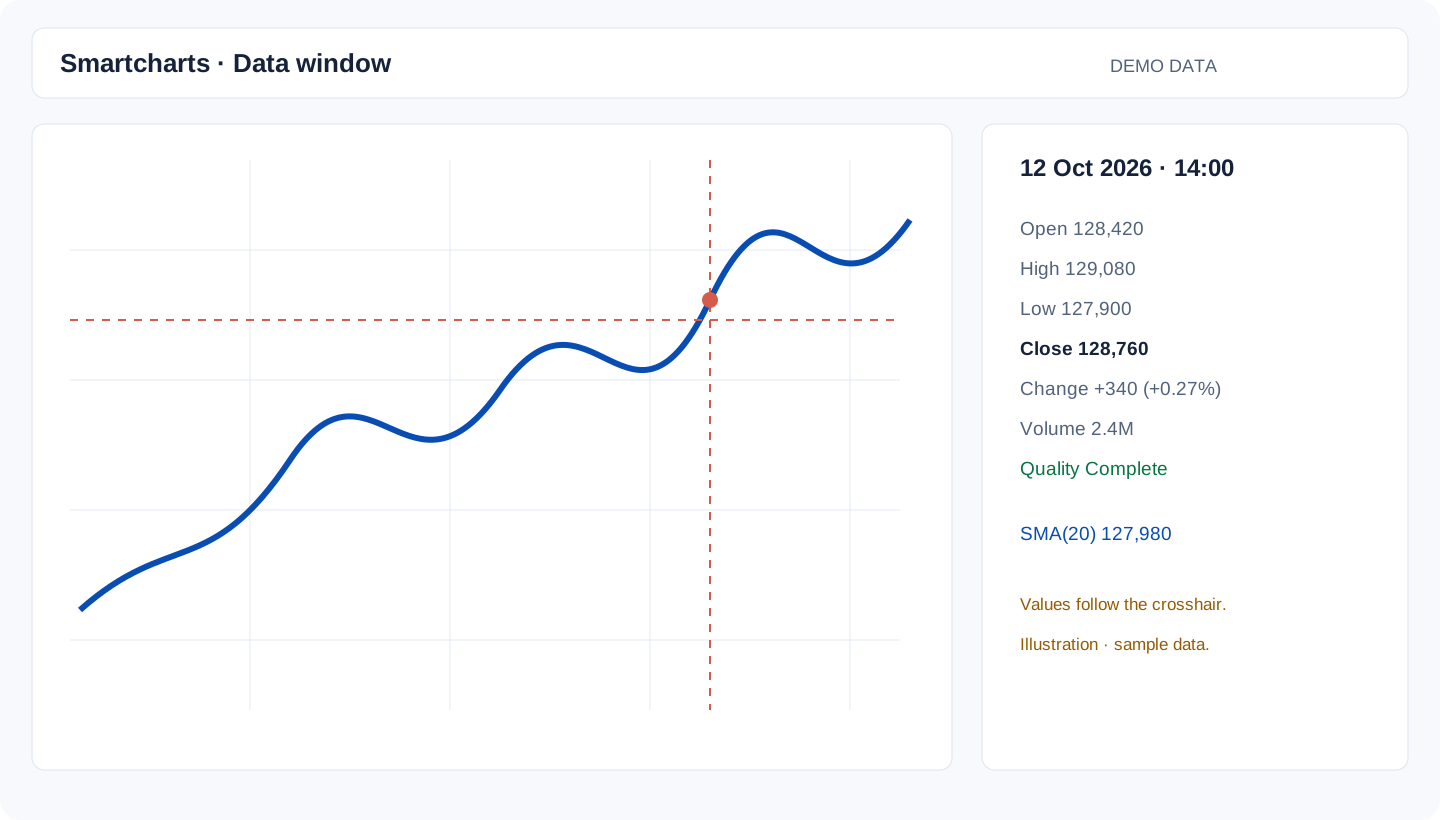
Crosshair and data window
Move the crosshair to inspect one bar. The data window reports the selected timestamp, OHLC, volume, change, data quality, and indicator values when those fields are available. See the data-window guide for the interpretation rules.
Drawing rail and object tree
The drawing rail adds annotations such as trend lines, channels, and Fibonacci tools. The object tree lists the drawings on the chart so you can select, hide, reorder, or remove them without hunting through the plot.
Alerts, replay, and sharing
Alerts describe a condition and its delivery settings. Replay controls let you inspect a historical sequence. Sharing controls preserve a view or layout for another person to open. None of these controls turns an observation into a trade instruction.
Data-quality messages
Unavailable controls have a reason: the series may be close-only, missing volume, or too short for an indicator warm-up. Read the message, then choose a compatible symbol or time range. Do not fill missing values from memory.
What this guide covers
- Where to find each chart control.
- Which pane owns each kind of value.
- Why a control can be unavailable.
What it does not cover
This is a product orientation guide. It does not recommend securities, predict prices, or replace a source review.
Next useful guide
Continue with how to read the data window, then choose an indicator.
Last reviewed