Smartcharts data window: read bar values correctly
The Smartcharts data window answers a narrow question: what values belong to the bar under the crosshair? This guide explains each field and the limits of a hovered value.
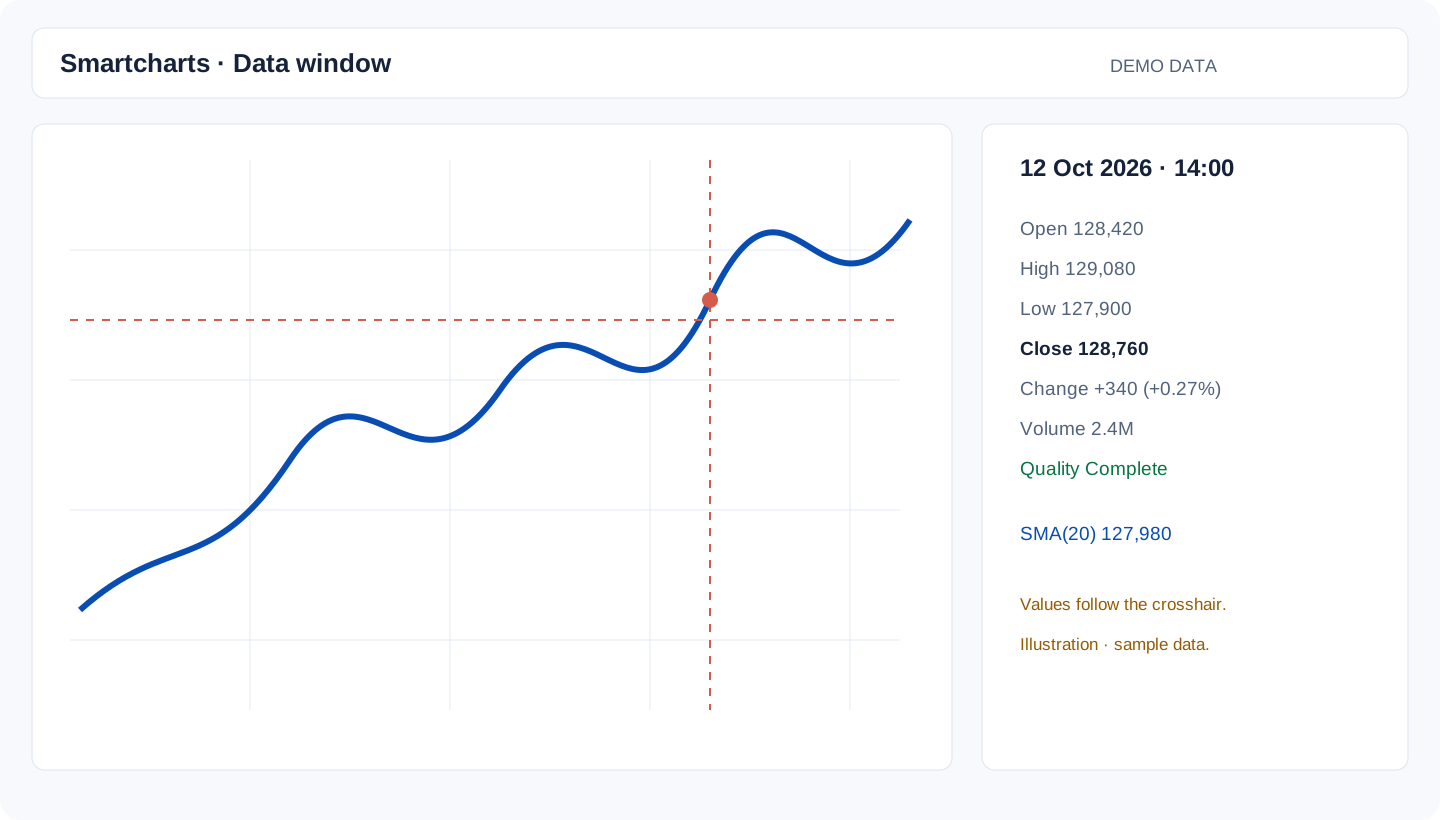
Values at the selected bar
The panel can show:
- Date and time: the timestamp supplied by the market-data series.
- Open, high, low, close: the four OHLC values when the source provides them.
- Volume: traded units, if the series includes volume.
- Change: the source-defined change for the selected bar.
- Data quality: a signal such as complete, delayed, or close-only.
- Indicator values: calculations at that bar after the indicator has enough history.
Close-only data and missing values
Close-only series cannot honestly display open, high, or low. The panel marks those fields unavailable instead of inventing values. Missing volume and unavailable fields should be treated as a limitation of the source, not as a zero.
Warm-up periods
Moving averages and other indicators need earlier bars before their first reliable value. During that warm-up period, an indicator value may be blank. Extend the time range or wait for enough history rather than reading the first visible bar as a signal.
Hovered-bar values versus last-bar values
The data window follows the bar under the crosshair. A summary card or alert may refer to the latest bar. Compare timestamps before you compare numbers.
A tooltip is not a trade instruction
A tooltip reports a historical or delayed observation. It does not account for liquidity, costs, taxes, news, suitability, or your objectives. Use the value as one input to research and record the source and timestamp.
Quick checklist
- Confirm symbol, exchange, currency, and timestamp.
- Check data quality before interpreting fields.
- Distinguish a blank value from zero.
- Check indicator warm-up and selected-bar alignment.
- Record the source and review date for important work.
Next useful guide
Read chart anatomy, then explore indicators or drawing tools.
Last reviewed