Trend line
A straight line between two points, used to follow the direction of a move.
What the drawing shows
A trend line joins two prices at two moments. Drawn under rising lows it marks an uptrend; drawn over falling highs it marks a downtrend.
The line records the slope between your chosen anchors and lets you compare later prices with that slope.
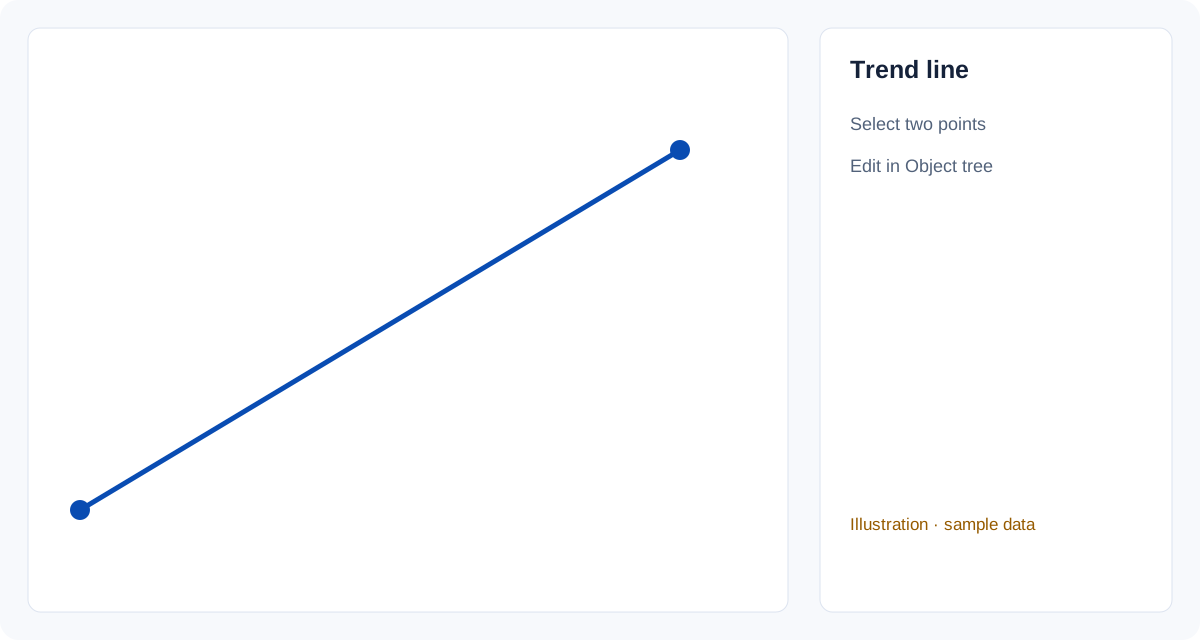
Place the drawing
Select Trend line from the drawing toolbar, then follow these steps.
- Click the first point, usually a clear swing low or high.
- Click the second point on a later swing in the same direction.
Read the drawing
Compare later touches with the anchors you chose. A touch does not establish that the next move will reverse.
A close through the line suggests the move it described has slowed or ended; it does not say what comes next.
The timeframe and anchor choices change the interpretation. A steeper line does not establish when a crossing will occur.
- Turn on extend right in the settings to carry the line into the future.
- Turn on the magnet in the left toolbar to snap each end to the nearest open, high, low or close.
Related tools
For selection, editing, and Object tree controls, see manage drawings.
Last reviewed